
Which models do we use?
Three methods cross-check NVIDIA's value per share. A discounted cash flow model tests long-term earnings conversion. A capex-capture model asks how much revenue and cash NVIDIA receives from cloud infrastructure spending. A sum-of-the-parts model values accelerated compute separately from networking, CPU, software and other activities.
Research date: 12 September 2026. The financial starting point is the balance sheet at 26 July 2026. The source study uses a $218.29 reference share price, not a live quote. The valuation comparison chart below rounds USD-per-share values to whole dollars; its dashed line is the same reference price.
Key assumptions
Management's approximately 70% FY2028 revenue-growth expectation, discussed on 26 August 2026, was preliminary and supply constrained, not guaranteed. It anchors the base DCF. Other growth paths, discount rates, margins and risk haircuts are model assumptions. NVIDIA earnings-call transcript
Amounts below are USD billions unless shown as percentages or multiples. ACIE means AI Clouds, Industrial and Enterprise. The funding-linked share and unsupported-demand share are analytical assumptions, not company-reported revenue classifications.
| Main assumption | Bear | Base | Bull |
|---|---|---|---|
| DCF FY2027 revenue | 390.0 | 405.8 | 415.0 |
| DCF FY2028 revenue growth | 50% | 70% | 80% |
| DCF weighted average cost of capital | 7% | 7% | 7% |
| DCF terminal growth | 2.0% | 2.5% | 3.0% |
| NVIDIA capture of top-five 2027 hyperscaler capex | 18.0% | 23.5% | 25.5% |
| ACIE growth from annualized Q2 revenue | 55% | 100% | 120% |
| ACIE share linked to NVIDIA funding | 65% | 50% | 35% |
| Unsupported demand within that linked share | 45% | 20% | 5% |
| Normalized FCF margin after revenue haircut | 38% | 48% | 53% |
| Net ecosystem funding / expected credit loss | 25.0 / 5.0 | 10.0 / 2.0 | 2.5 / 0.5 |
| Enterprise value / economic FCF | 17x | 22x | 25x |
| SOTP FY2029 revenue | 640 | 814 | 934 |
| SOTP discount rate | 10.0% | 9.0% | 8.5% |
The top-five 2027 hyperscaler spending pool is $1.3 trillion, based on management's estimate on that call. The base DCF assumes approximately $690 billion FY2028 revenue and a 72.5% gross margin. Growth then slows and gross margin fades to 64% by FY2036. All models use 24.147 billion diluted shares.
Fair value under three scenarios
Values are USD per share. Each median is the middle result among three models within the same scenario. It is not a probability-weighted expected value or a promised price.
| Scenario | Bear | Base | Bull |
|---|---|---|---|
| Three-model median | 129.12 | 268.65 | 396.53 |
| Difference from the $218.29 study reference | −40.8% | +23.1% | +81.7% |
My focus is whether cash collection and real utilization support the base case. Revenue growth alone is insufficient: independent customer payments and cash remaining after strategic investment affect the credibility of the valuation.
Details behind the three models
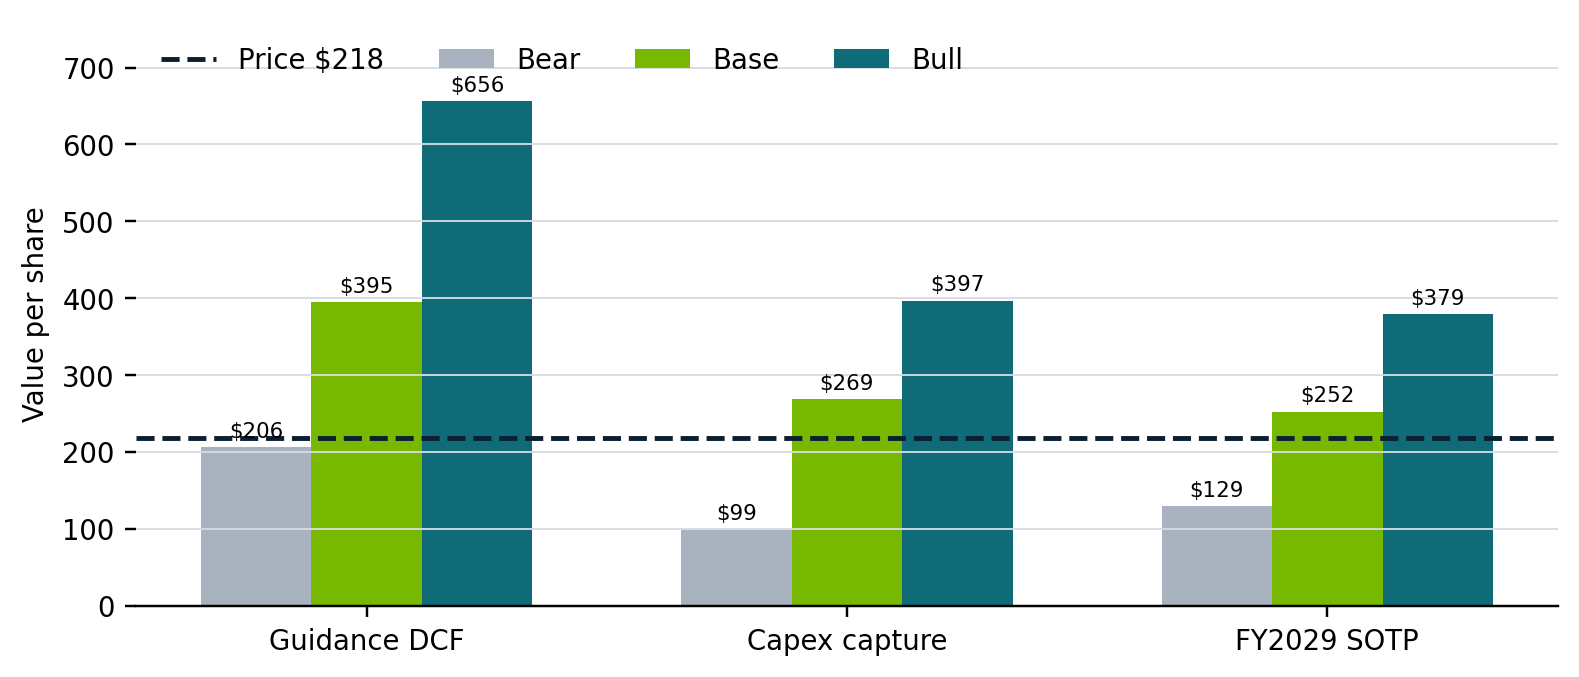
| Estimated value per share (USD) | Bear | Base | Bull |
|---|---|---|---|
| Guidance-anchored DCF | 205.78 | 394.56 | 656.31 |
| Capex capture and neocloud risk | 99.28 | 268.65 | 396.53 |
| FY2029 segment earnings-power SOTP | 129.12 | 252.00 | 378.91 |
DCF. Forecast revenue, gross margin, operating expenses, taxes and reinvestment through FY2036, then add terminal value. The first forecast year subtracts H1 reported FCF already reflected in the starting balance sheet. Discount the remaining cash flows using the workbook's timing, add core net cash and haircutted strategic investments, and divide by shares. A 7% WACC is favorable; terminal value contributes approximately 67% of base enterprise value.
Capex capture. Multiply top-five hyperscaler spending by NVIDIA's capture rate. Add ACIE and other revenue, haircut the funding-linked portion lacking independent demand, and apply a normalized cash margin. Deduct net ecosystem funding and expected credit losses, capitalize economic FCF at the scenario multiple, then add net cash and haircutted investments. These are normalized model forecasts, not reported cash-flow results.
SOTP. Estimate FY2029 after-tax operating earnings for three business groups, apply separate multiples and discount back to the starting date. Add interim FCF and asset adjustments. This provides a different valuation method and higher discount rates, but uses the DCF's interim cash flows, so it is not wholly independent evidence.
| Base SOTP business group | Revenue mix | EBIT margin | After-tax operating earnings multiple |
|---|---|---|---|
| Accelerated compute | 70% | 58% | 16x |
| Networking, CPU and software | 25% | 55% | 21x |
| Edge and other | 5% | 35% | 13x |
Profit allocations for these groups are analytical estimates, not reported segment profits. All three approaches remain exposed to common AI-spending and growth assumptions. Taking a median does not remove model risk.
Why the discount rate matters
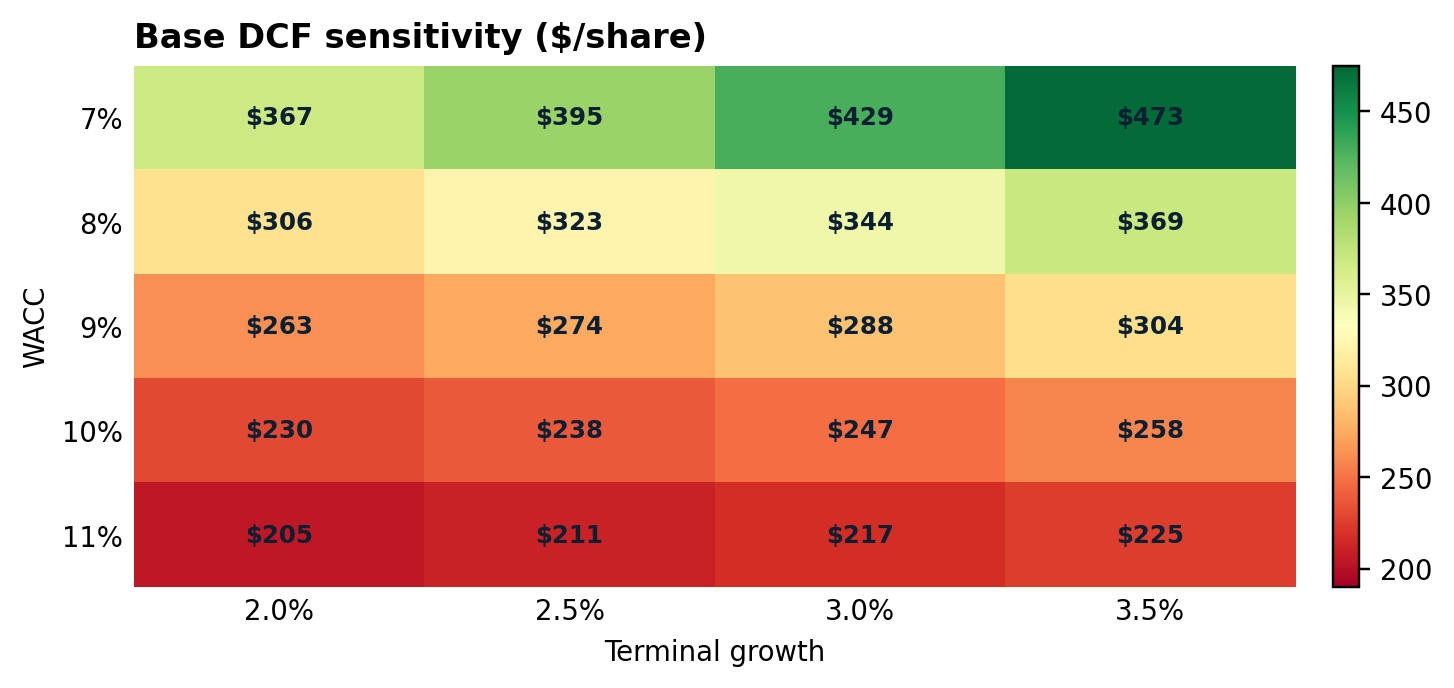
With the base operating forecast and 2.5% terminal growth unchanged, moving WACC from 7% to 10% reduces estimated value from approximately $395 to $238 per share. I therefore treat the 7% DCF as a favorable long-term reference alongside the other two methods.
Neocloud financing and cash conversion
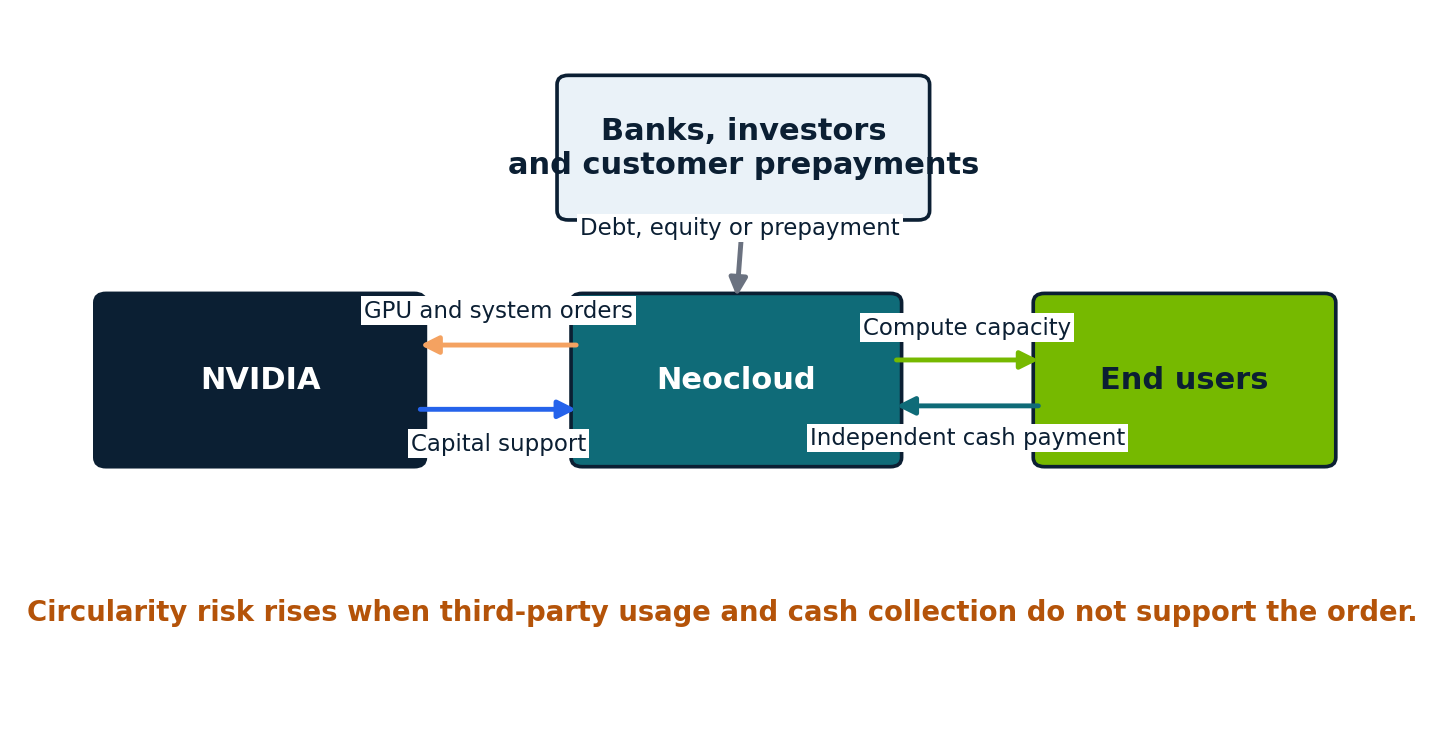
Neoclouds are cloud providers focused on GPU compute. Customer payments, NVIDIA equity investments, capacity commitments and credit guarantees should be examined separately. Capital support does not by itself imply fictitious revenue. The test is whether unrelated end users consume capacity and pay cash.
NVIDIA reported $69.895 billion of non-GAAP FCF in H1 FY2027 and $42.404 billion of equity-security purchases. Their difference is $27.491 billion, rounded to $27.5 billion in the chart. This is a cash-conversion diagnostic, not a new accounting profit measure or cash after every other use. NVIDIA CFO commentary NVIDIA 10-Q
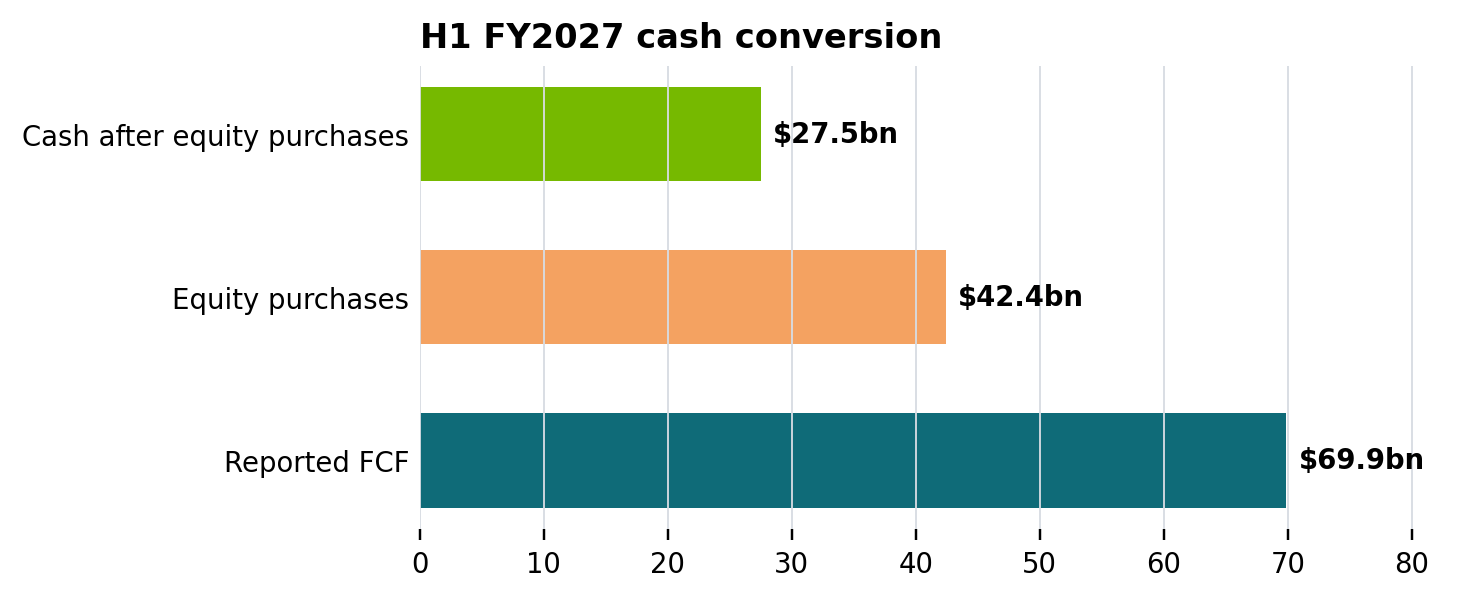
Equity purchases acquire investment assets. They are not all expenses or all neocloud funding. The models separately haircut retained investments; future funding needs and existing assets must remain distinct. The capex model's base $10 billion net ecosystem funding deduction and $2 billion expected credit loss are scenario inputs, not reported losses.
DSO increased sequentially from 45 to 60 days. NVIDIA attributed the change to extended terms for certain investment-grade customers. That deserves monitoring but does not independently establish default or fabricated revenue. NVIDIA CFO commentary
Industry position and what I will monitor
My research thesis is that NVIDIA's advantage combines GPUs, systems, networking, CPU and its CUDA software ecosystem. AMD, cloud providers' custom silicon and networking alternatives compete for the same budgets. Increased value per system needs to be judged alongside cash collection and capital commitments.
- Demand: hyperscaler capex, NVIDIA's capture rate and independent utilization outside the largest clouds.
- Cash: DSO, customer prepayments, cash after equity purchases, guarantees and capacity commitments.
- Margins and competition: memory and system costs, networking and software mix, and competing platform deployments.
- Execution: product transitions, advanced packaging, power and construction. Delays can postpone revenue and cash conversion.
Sources and limitations
Adapted from the 12 September 2026 NVIDIA AI Industry Position and Valuation Report and its companion workbook. Valuation outputs map to the Summary sheet; assumptions and calculations are on DCF, Capex Capture and SOTP. The four original research figures are retained.
- NVIDIA Q2 FY2027 10-Q: financials, investment assets, commitments and risks.
- NVIDIA Q2 FY2027 CFO commentary: revenue, FCF and collections.
- 26 August 2026 earnings-call transcript: preliminary FY2028 expectations and hyperscaler spending estimates.
- NVIDIA FY2026 10-K: business platform and risks.
Personal research and learning, not investment advice, solicitation or a promise of returns. Scenarios carry no assigned probabilities or target-price deadline. Changes in assumptions, market prices and operating conditions require a fresh valuation.